


Have you already planned an end of year campaign for your customers? I shared some examples and tips in our guide on how to plan great Year in Review campaigns, showing you what's important. In our opinion, personalization is a must-have!
So in this article, I'm going to show you how you can automatically create personalized, shareable graphics showing a recap of your user's year. We'll use Airtable and Placid to do that. Sign up for a free Placid trial if you haven't already.
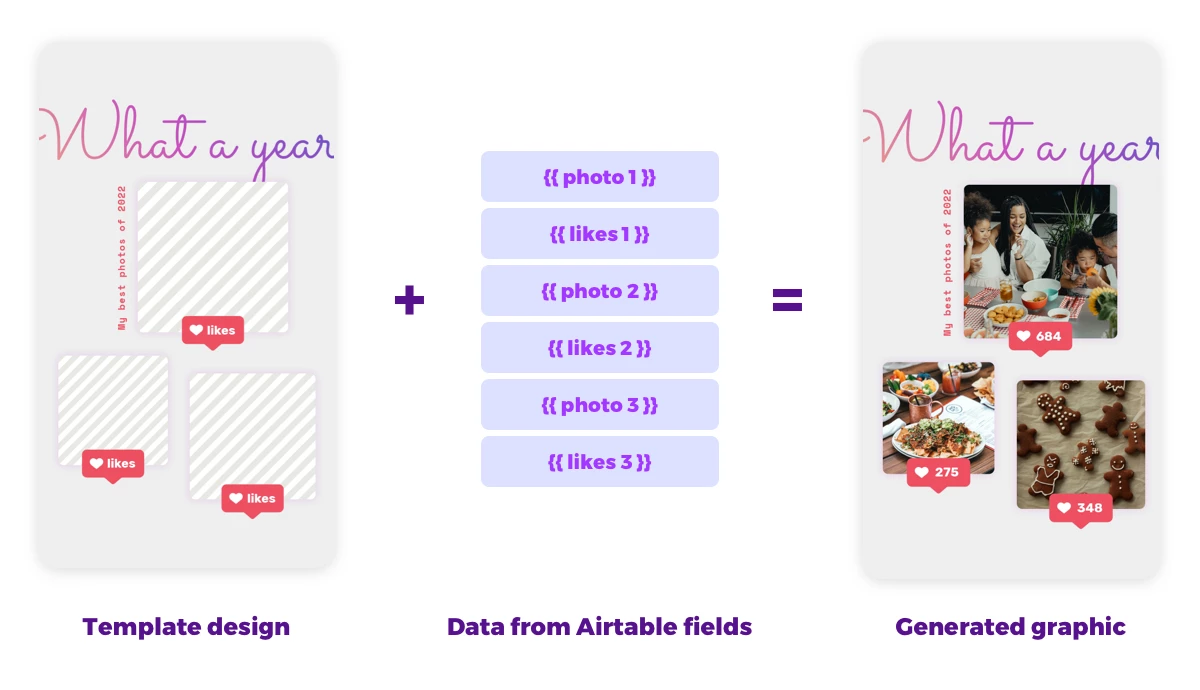
What we're going to build
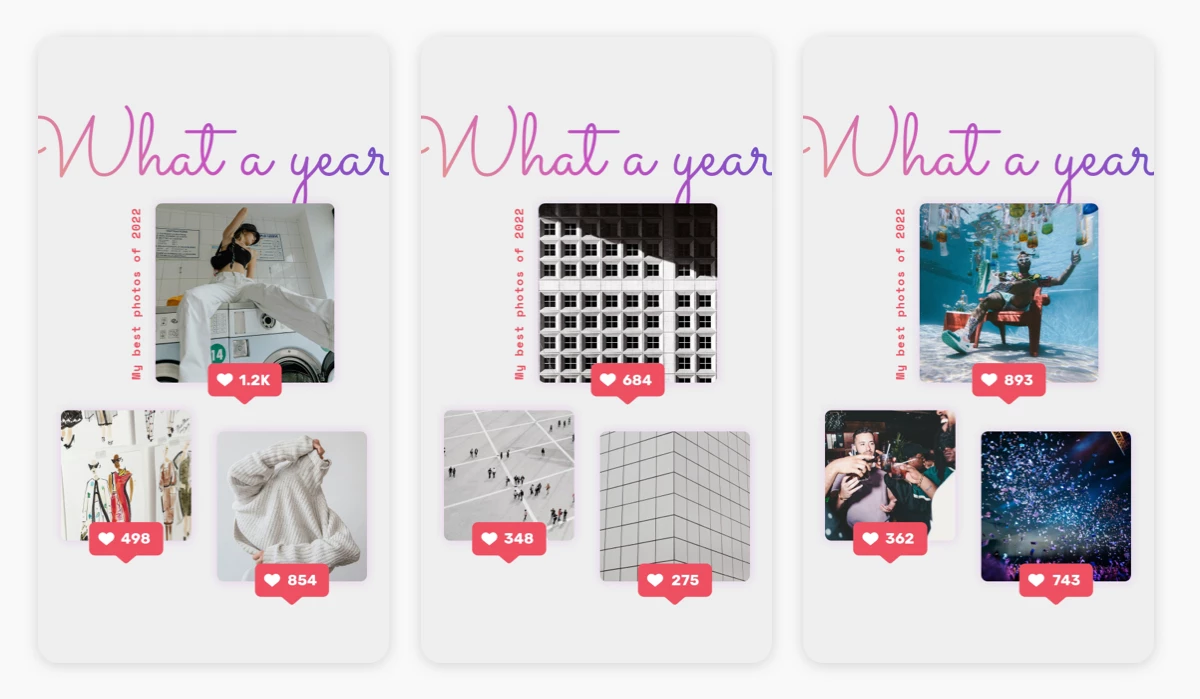
For this tutorial, I chose a fictional photo sharing app as an example. We're going to create a visual that shows our users their three most likes photos.

It might be inspired by Instagram's famous Top Nine recap 😉 I talked a bit about this and more inspiring campaigns in our Year in Review campaign guide!
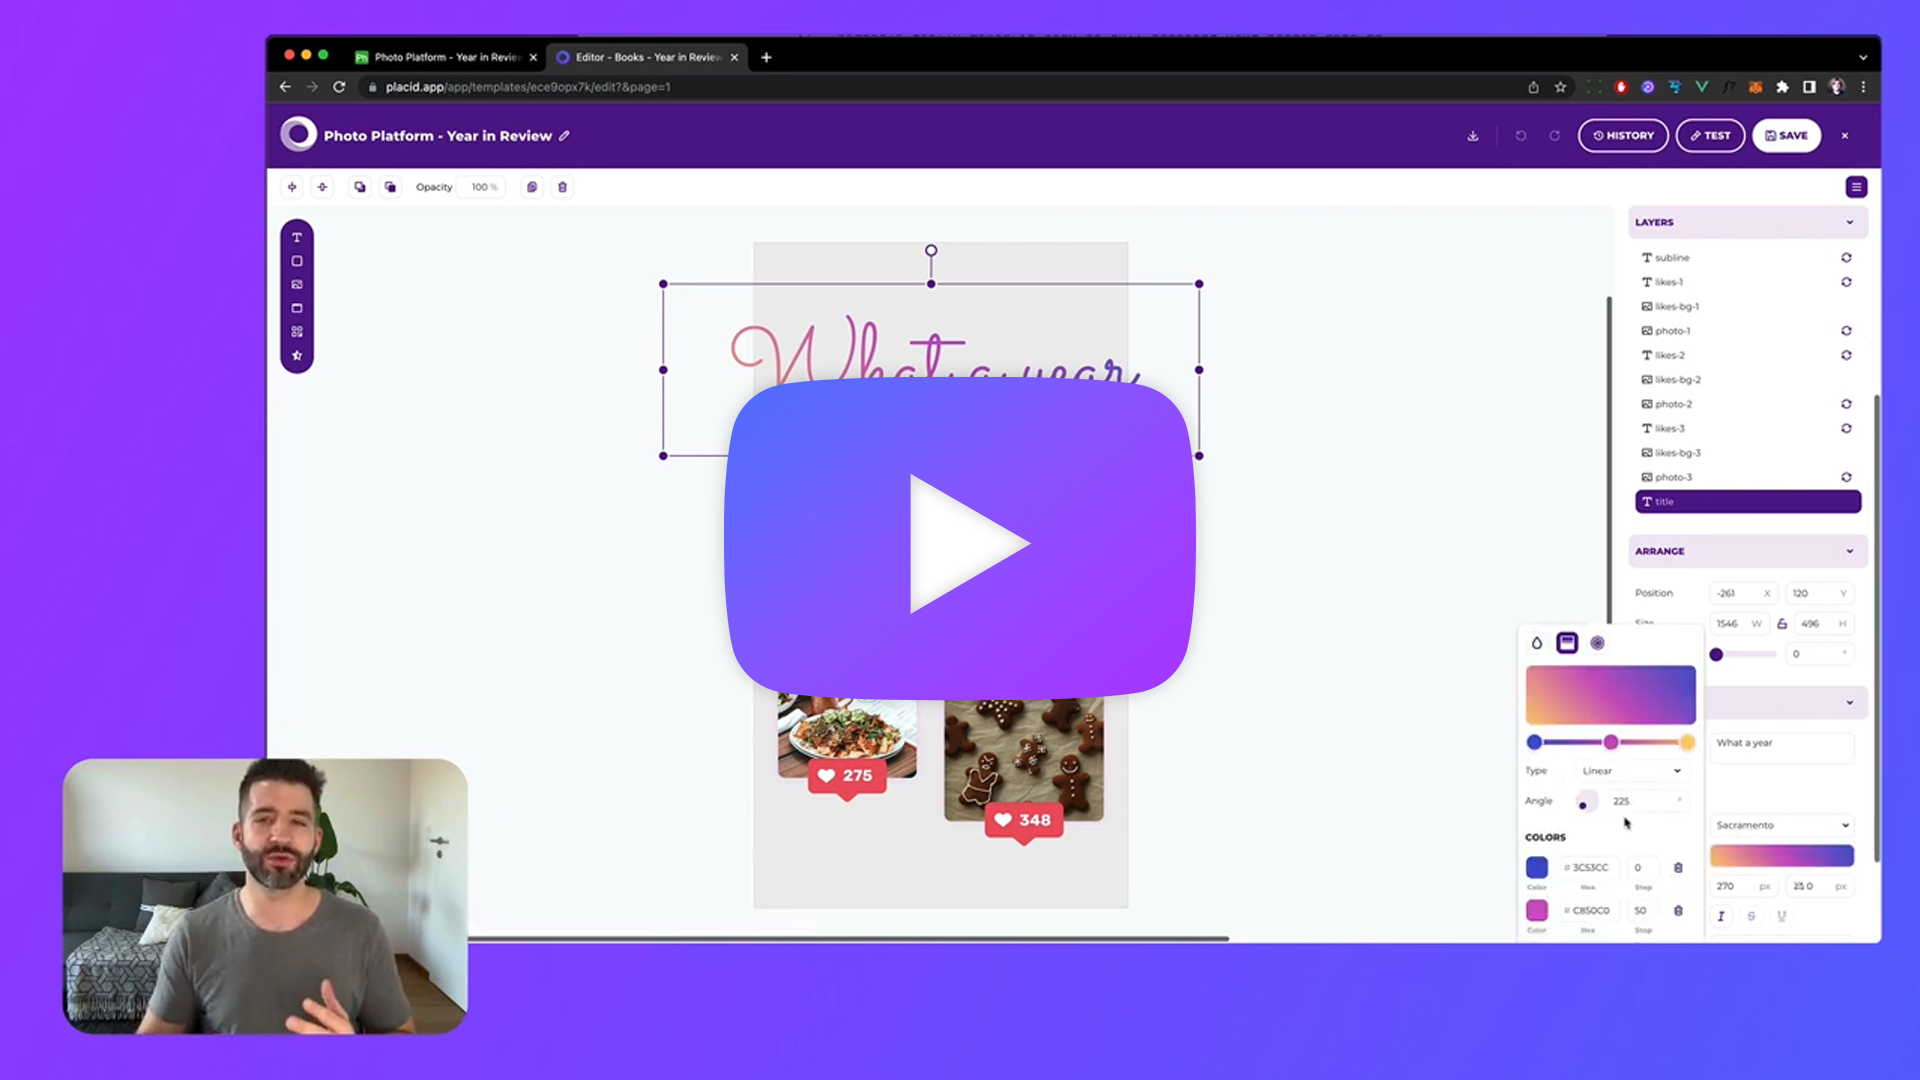
Video Tutorial
Prepare the data for your campaign
We think it's super important to have a personalized element in your end of year campaigns. Gathering your data and having it available in a structured form is necessary to create our image automation.
What kind of data you need for your campaign depends on your app / product / service. For this tutorial, we chose the top 3 photos of a user, and the number of likes they got on them.
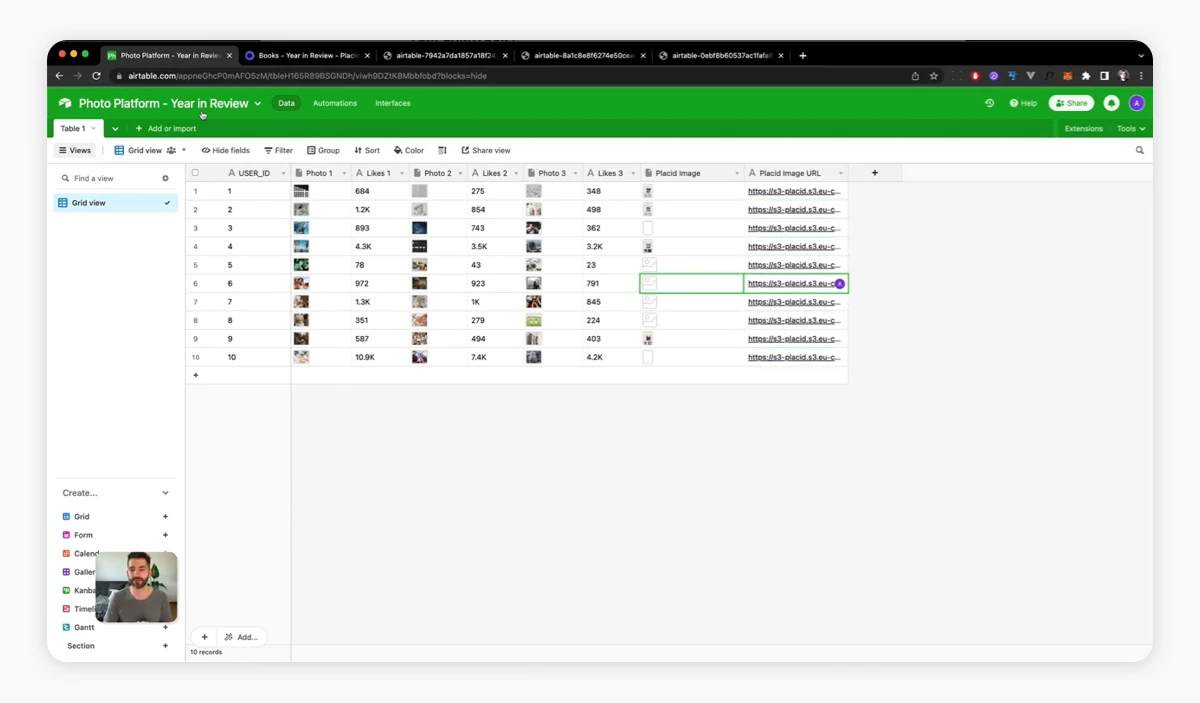
I prepared an Airtable with these fields:
User ID(number) to know which user's data we're seeingPhoto 1,Photo 2,Photo 3(attachment) for the top liked imagesLikes 1,Likes 2,Likes 3(text) for the number of likes (in readable form like 7.4k)Placid Image(attachment) is where we will send our generated graphics toPlacid Image URL(text) is where we will additionally send a link to our graphics
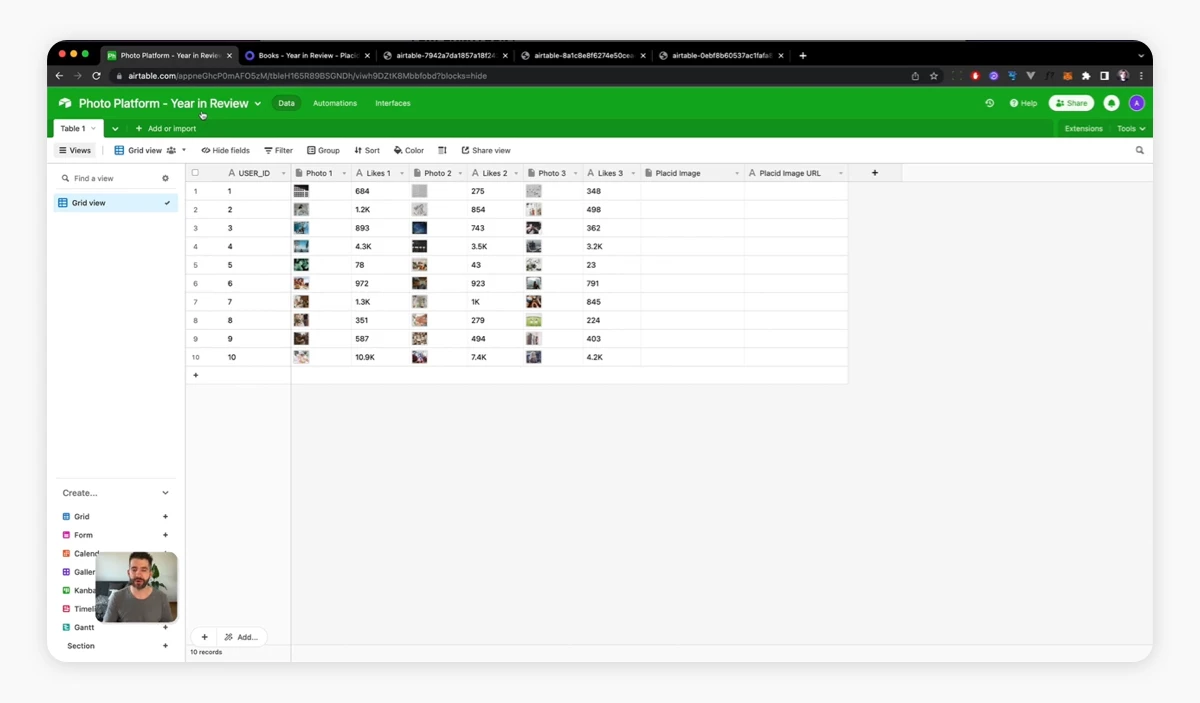
For this tutorial, I used around 10 rows of example data so you can see some generated variations at the end.
Set up a Placid project with an Airtable integration
First, we'll need a Placid project with an Airtable integration. In Placid, click Projects > Add new project, or add the integration in the settings of an existing project.
To complete the setup, we need to add our Airtable API key in the Placid project settings. You can find it in your Airtable account settings. Now Placid can access your Airtable data and use it for creative automations.
Create a template for your visuals
Next we need a template for our auto-generated graphics. A Placid template has dynamic text and image layers that can be filled with our data later.
To design one yourself go to Projects > Templates > Create Template. Choose one of our preset designs or start with a blank canvas. I chose the story format (1080x1920), as I wanted it to be a nice shareable for our users.
Our drag & drop editor lets you create your own designs easily. Create layers for all of your data (in our case: 3 photos and their amounts of likes).
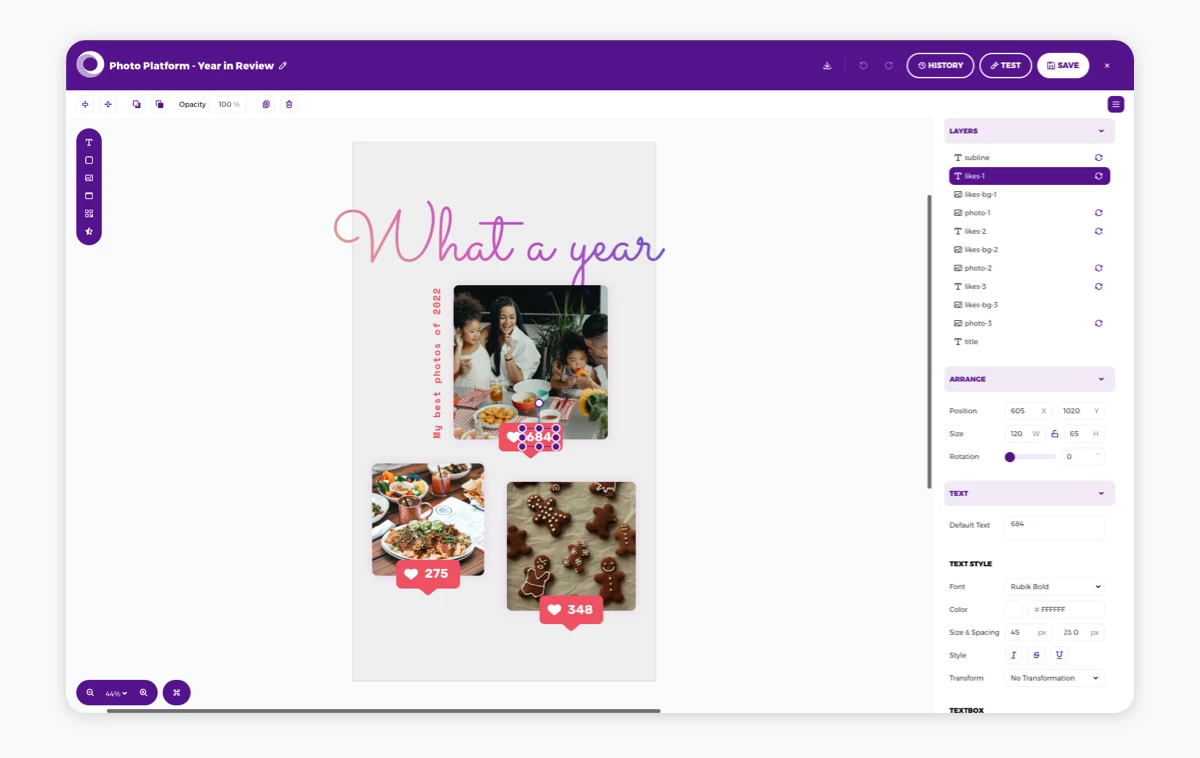
The layers that are going to be filled with data later (photo 1-3 and the like counts 1-3) need to be set to dynamic. Make sure they show the active 🔄 dynamic icon in the layer list. Deactivate it for all others.
Create a Placid Airtable action
To create our automation, we need to use Placid actions. Go to the Actions menu in the sidebar and click Add Action.
Basic setup & data selection
- I titled the action
Year in Review Image - I left the Action interval to be On-Demand, so the action only generates graphics when I start it manually
- I added my Airtable Base ID (find it under Help > API Documentation in your Airtable base)
- I added my Table name from Airtable (the name of the "sheet")
- We don't need any other settings for views, filters or webhooks
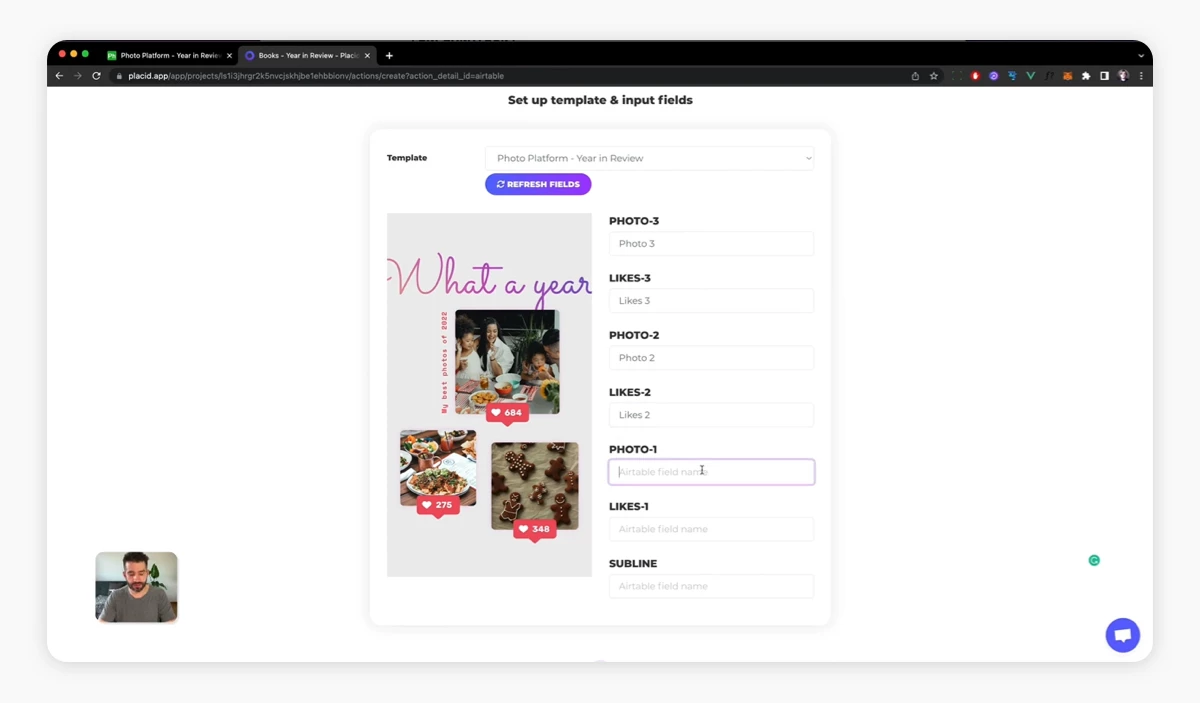
Data mapping for template layers
In step 3 of the action setup, we need to choose our template. Then we can connect the Airtable fields with the dynamic layers of the template. This way we're defining which data from our rows should be filled into which (text or image) layer.
Type in the name of your corresponding Airtable fields for every dynamic layer.
Define output fields
In the last step of the action setup form, we are going to input the names of the empty Airtable fields where we want our images and image URLs to go: Placid Image URL and Placid Image.
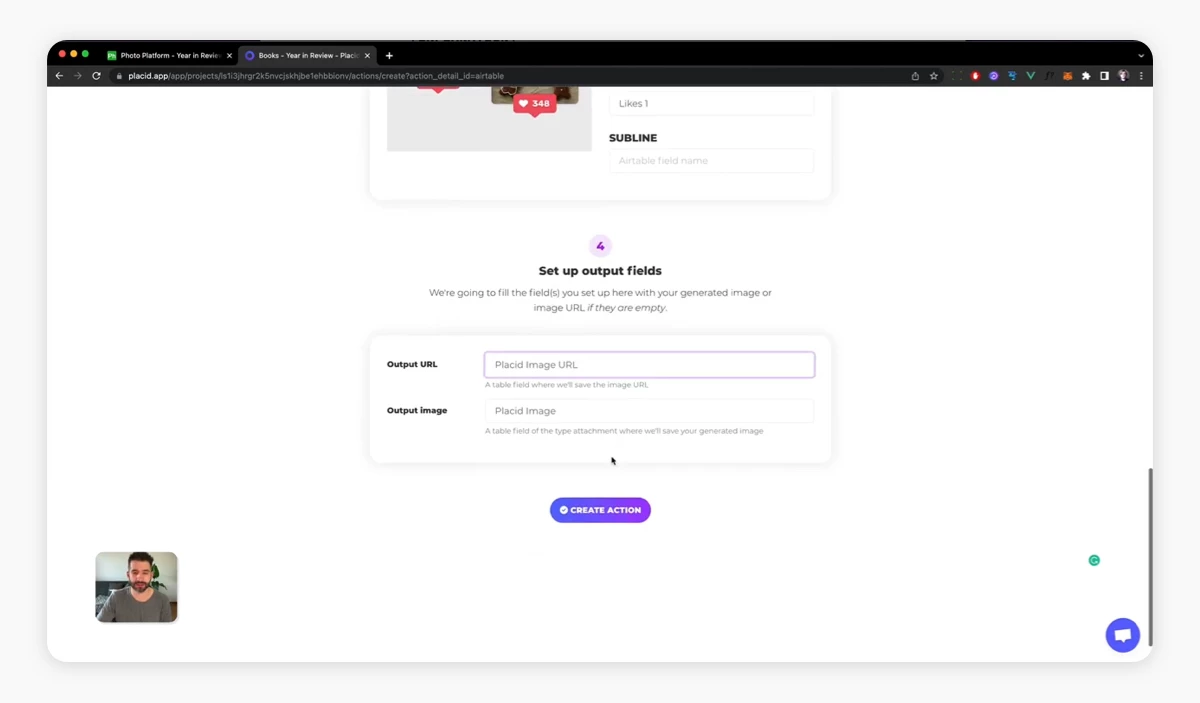
Then, click Create Action to finish your setup!
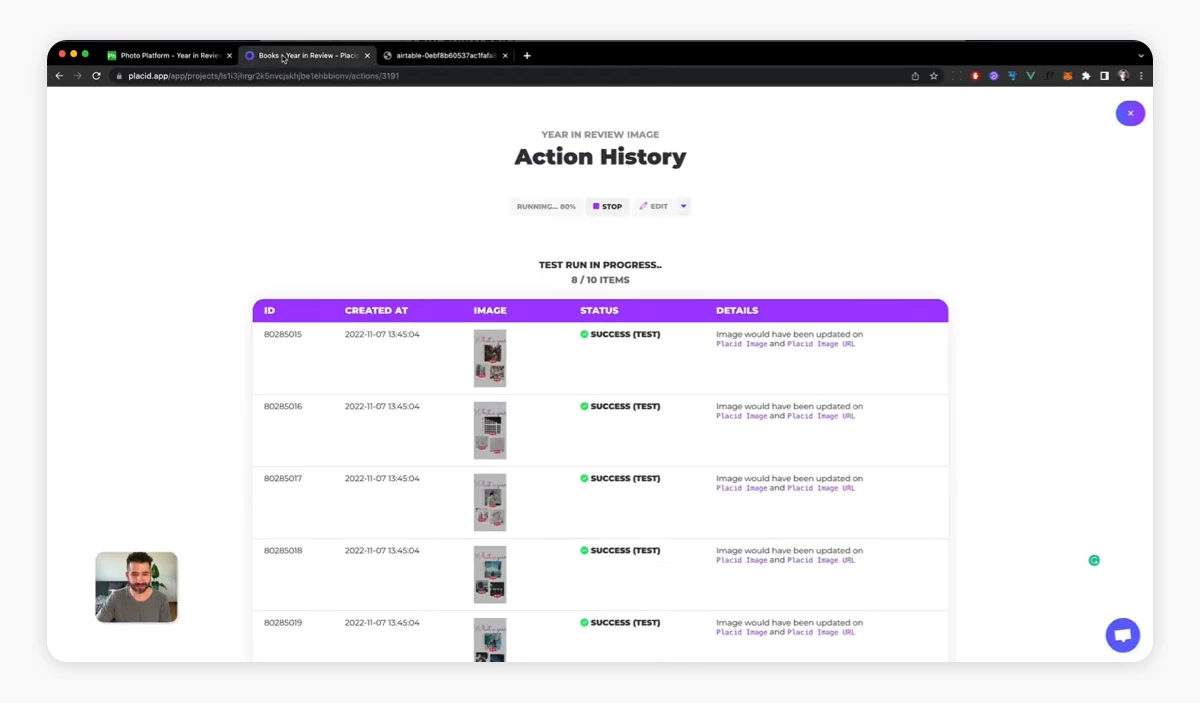
Run the action
You can start a test run of your action now to see whether your action does what it's supposed to do. Placid will show you the action's progress / status and the (watermarked) generated images in Placid.
If you're happy, click Run to actually start the action, which will send the generated images back to your Airtable.
Aaand that's it! 🥳 Your generated graphics are ready to use in your campaign.
What's next?
In this tutorial, we generated personalized visuals from data in our Airtable.
This doesn't have to be the end of your automated workflow, though! Add some more steps to it with workflow automation tools like Make or Zapier, or use Airtable automations to run custom scripts, send Slack messages or create tweets.
I wish you the best of luck with your Year in Review campaign. If you need more support for your auto-generated visuals,