


If you have read our Year in Review campaign guide, you already know why personalization is super important to create a great end of year campaign for your customers.
In this hands-on tutorial, we're going to set up a workflow with the nocode tool Zapier that generates personalized visuals for your campaign from your data. You'll need Zapier and Placid accounts to follow along. Sign up for a free Placid trial if you haven't already!
What we're going to build
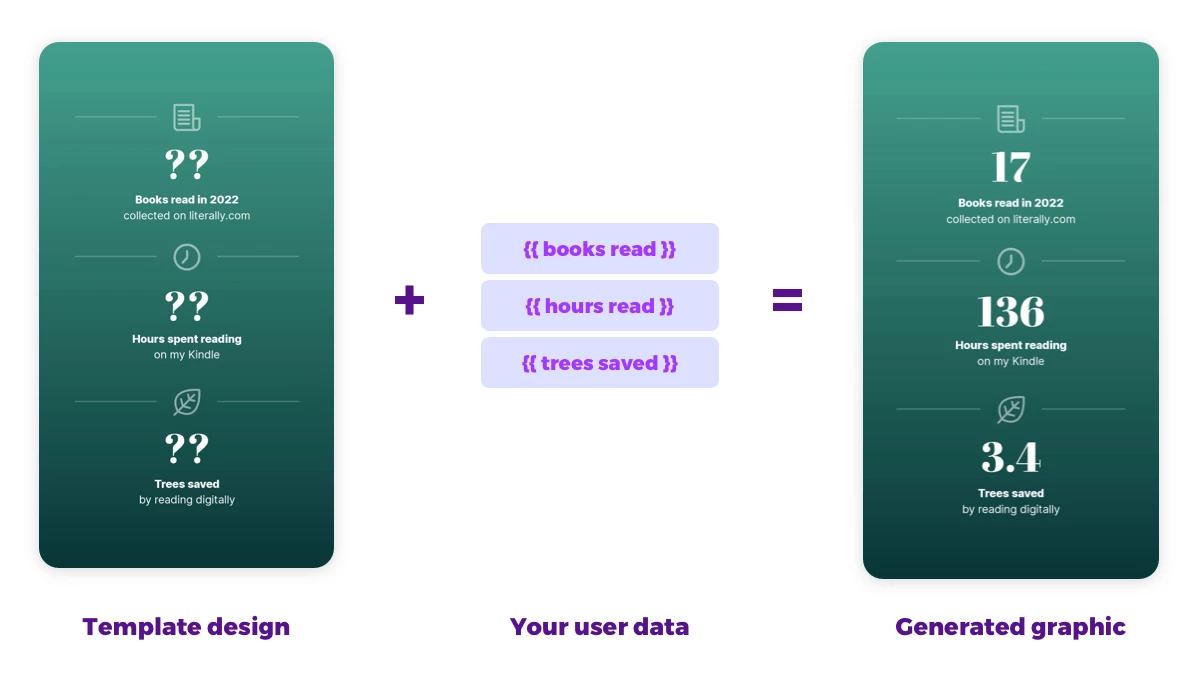
For this tutorial, we're going to create a visual for the members of our fictional community for readers. There, they logged what books they've been reading on our platform throughout the year, and we are going to show them their annual stats.
I'm going to build a demo workflow with Zapier, showing you how to drop in the Placid automation into your process.
Video Tutorial
Prepare the data for your campaign
To personalize our visuals, we first need our user's data.
We need to know how much they read this year to calculate their personal statistics. For your own campaign, you will need custom metrics, obviously: Think about what best reflects how you brought your users value this year.
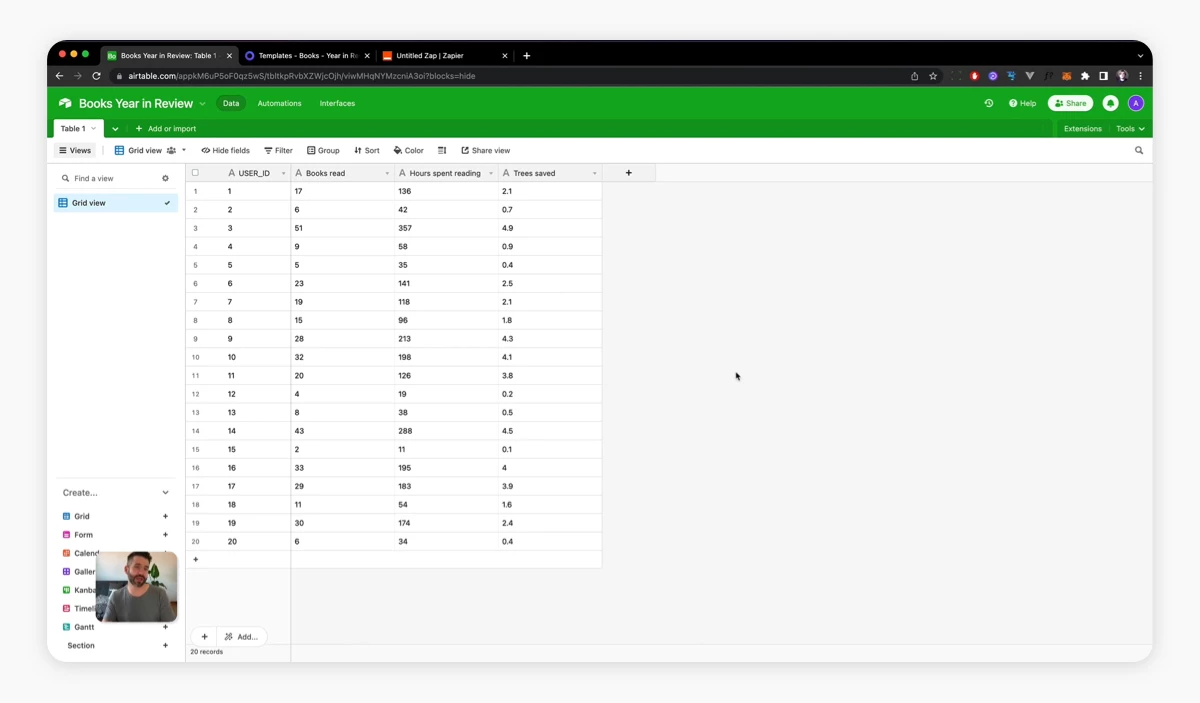
For our tutorial, I used Airtable to hold my data as an ad-hoc substitute for your app's database, where the values would usually live.
I have these fields:
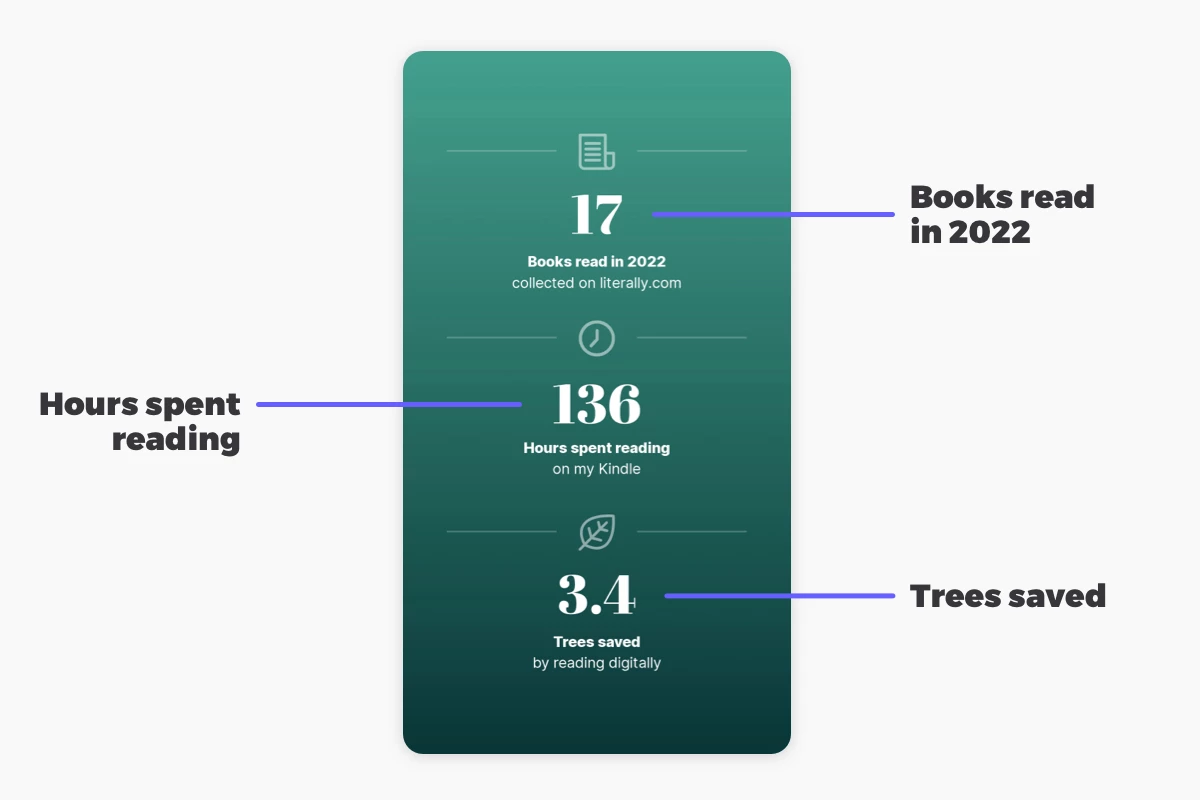
User_IDto know which user's data we're grabbing (like you would have it in your database)Books read- the books they logged on our platformHours spent reading- this could be data from their eReaderTrees saved, calculated from the number of pages of the printed versions of books they read digitally
Set up a Placid project with a Zapier integration
First, we need to create a Placid project with a Zapier integration. In Placid, click Projects > Add new project, or add the integration in the settings of an existing project.
Create a template for your personalized visuals
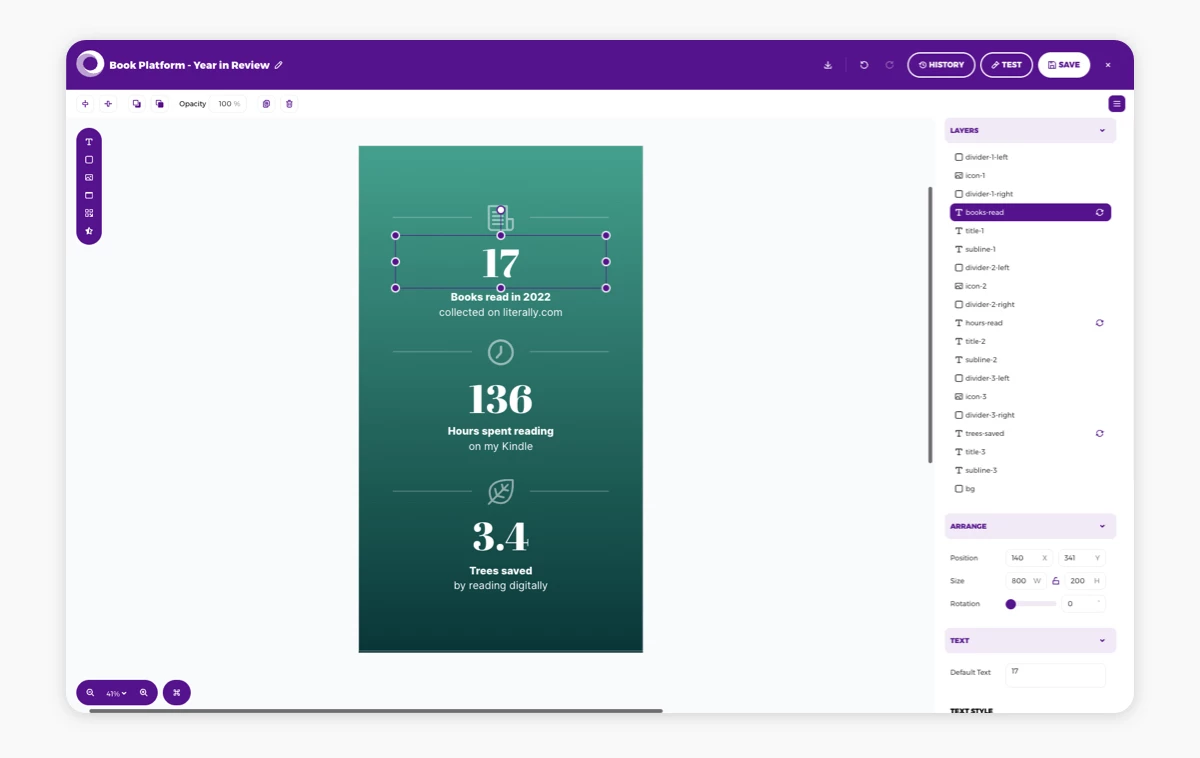
Now we are going to create the design for our visual, using a Placid template. It has dynamic layers that can later be filled with images and text from our user data in our automation.
In Placid, go to Projects > Templates > Create Template. You can choose one of our preset designs or design your own template from scratch. For this tutorial, I chose a story format (1080x1920), as it's shareable on many platforms.
Use our drag & drop editor to create a design you like. Make sure you have layers for all of your metrics, and set them to 🔄 dynamic in the layer list.
Start a Zap with an action to grab your data
Now go to Zapier and create a new Zap.
First, add a trigger event. I chose the call of a webhook (Catch Hook in Webhooks by Zapier) so I can use this workflow kind of like a microservice for my campaign creation process. You could then e.g call the webhook with a user ID to generate an image for a specific user within your landing page.
Next, add an action to grab your data from your database. I added the Find Many Records (With Line Item Support) in Airtable action.
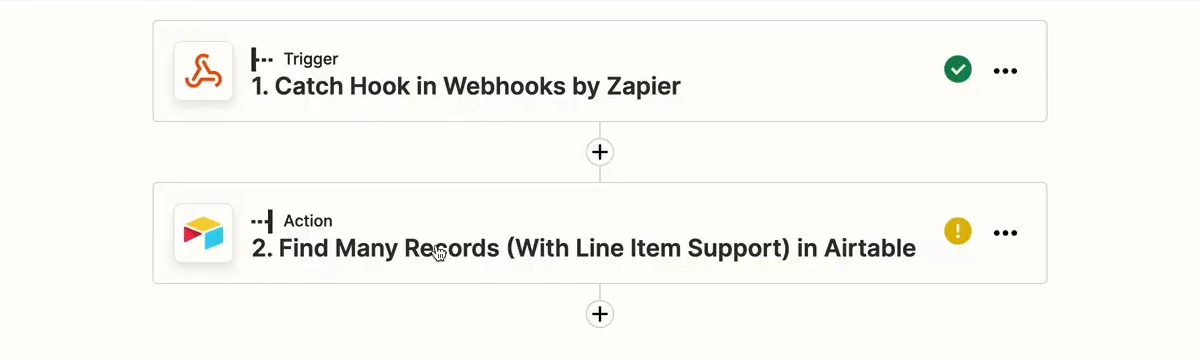
After connecting my account, I entered my Base and Table names so Zapier knows where my data lives. As this is a demo routine, I added a filter Search by Field User_ID and the Search Value 1 to test with the first record of my table.

Test the action now to see if it returns the correct record before we go to the next step.
Add a Placid action to generate visuals
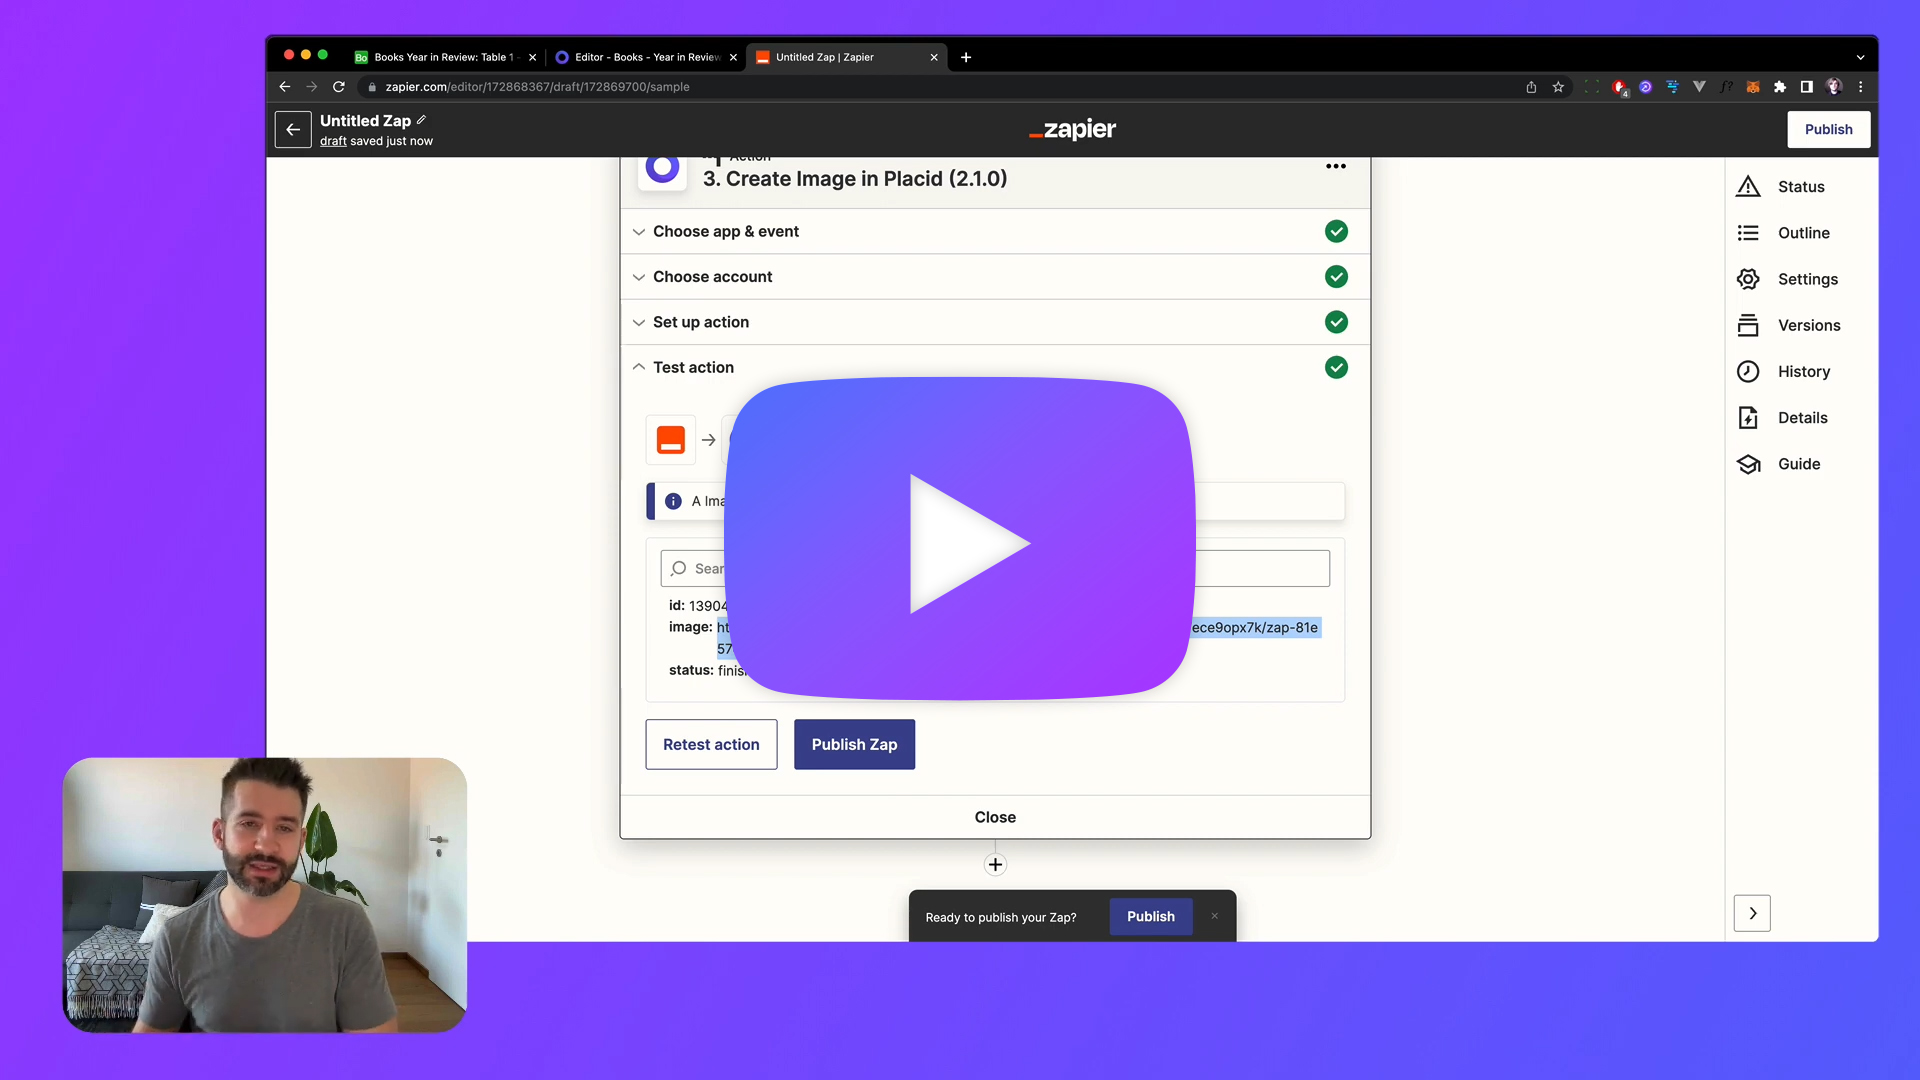
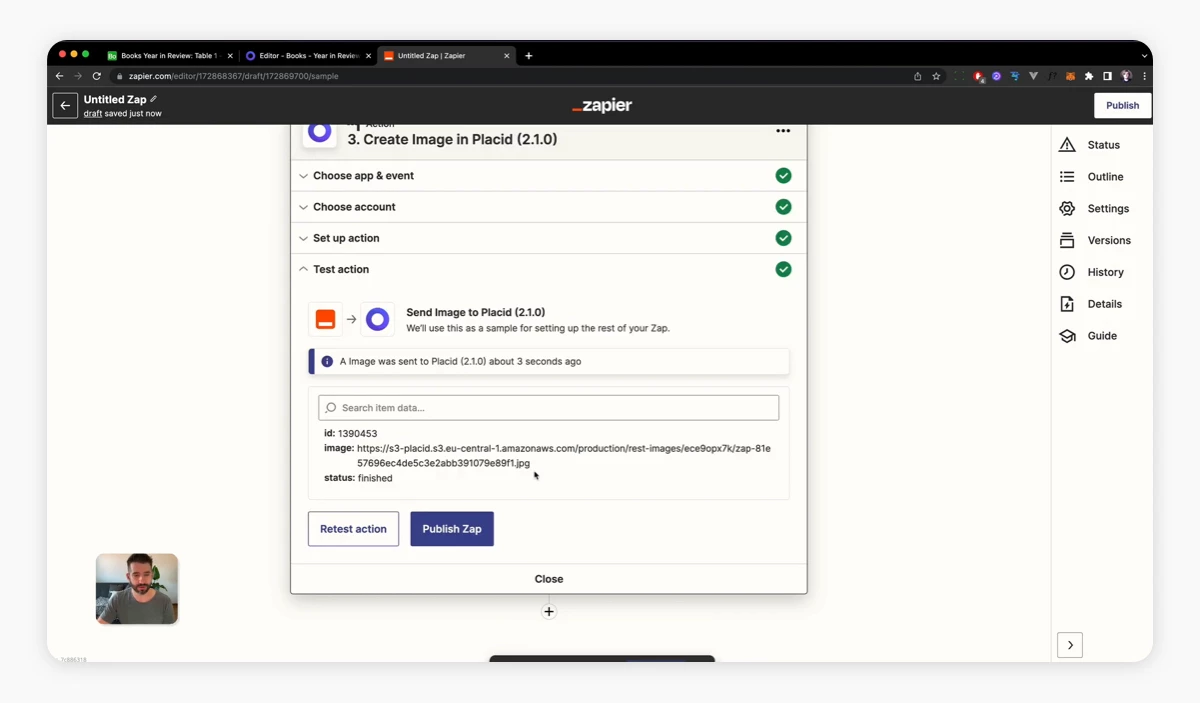
Add another action, choosing the Placid > Create Image event.
Connect your Placid account by entering your API Token from Placid. Find it in the API Tokens menu or by clicking the Integrate button of your template.
Then choose your project and template. Zapier should now display all of the dynamic layers of your template.
Click into the (text) input fields of your layers and choose the data you want to fill it with. In our example, I chose the Airtable field names Books read, Hours spent reading and Trees saved for the three text layers containing our metrics.

You can now test your action. Once it's finished, Zapier will show you an image URL to your first generated image.
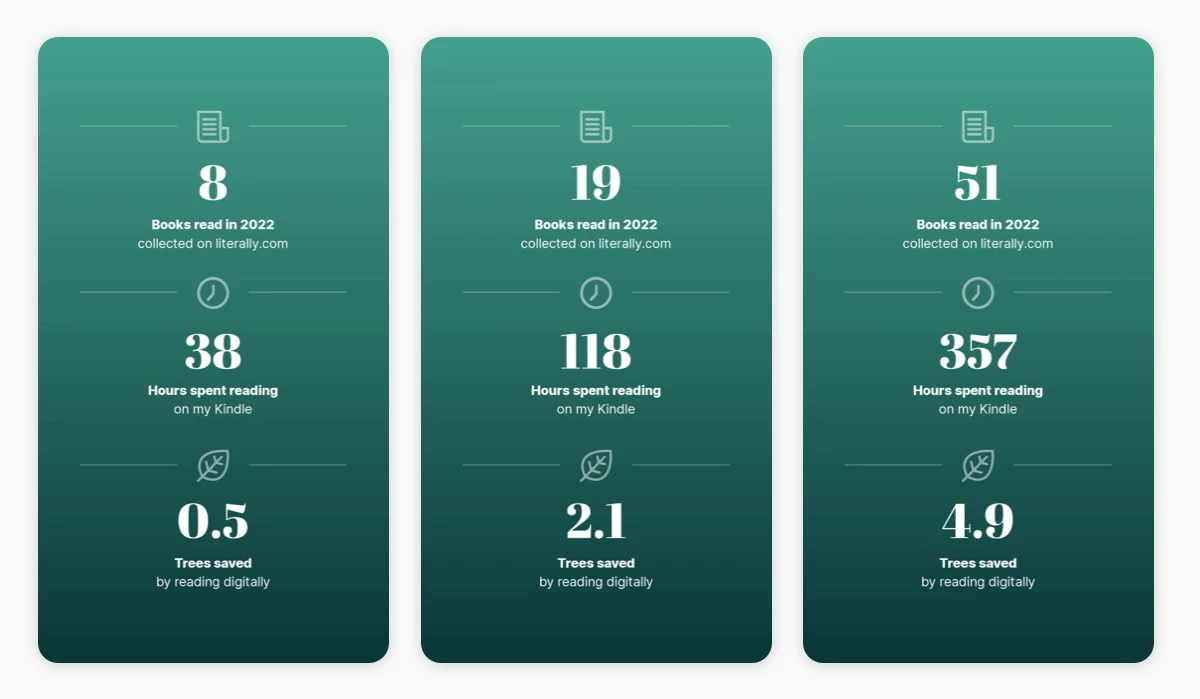
Open it to check your generated image. With my data, I generated these variations, calling different user IDs in my Airtable action:
What's next?
So far we have set up the first steps of our workflow: Taking our data and generating our campaign visuals. You can complete the process with any other actions you like – send them to your customers via email or save them somewhere else (e.g. your storage or your Google Drive). With all the integrations available, Zapier is very flexible.
I hope your users will love (and share) your Year in Review campaign and visuals. If you want to talk about your ideas or need support,